

Yet modern digital business demands that the entire constellation of these far-flung cloud services, resources, and application constituent parts coalesce perfectly. The end result must be real-time and always-on user experiences that delight, and business transactions that are both highly secure and never fail.
Bridging the gap between such daunting complexity and awesome performance and security requirements means gaining the best visibility into all aspects of the hybrid- and multi-cloud continuum.
Listen to the podcast. Find it on iTunes. Read a full transcript or download a copy. Watch the video.
Stay with us as BriefingsDirect explores the ways that deep observability moves past the limitations of metrics, events, logs, and traces to deliver far richer and faster data-driven insights. By exploiting these new means of pervasive deep observability, the highest levels of security, performance, and agility can be attained by nearly any business and organization.
To learn how, please welcome Bassam Khan, Vice-President of Product and Technical Marketing Engineering at Gigamon. The interview is moderated by Dana Gardner, Principal Analyst at Interarbor Solutions.
Here are some excerpts:
Gardner: Bassam, what are the main pain points you’re seeing for the cloud security operations (SecOps) and network operations (NetOps) teams as they strive to keep their environments performant, dynamic, and responsive -- given all of this difficulty and complexity?
Khan: Yes, it’s about being dynamic, performant, secure, and economical -- that’s the other aspect we keep hearing about. The pain for operations teams nowadays is to stay out of the way of progress, and to not get in the way of application development, business transformations, workload modernization, and application modernization. Progress can be defined truly as an organization’s ability to move fast by leveraging all of the applicable cutting-edge technologies out there today.
 |
| Khan |
The pain is also about allowing developers to move very fast, without any involvement from IT groups -- particularly from operations -- unless something goes wrong. That could be when an application breaks, costs overrun, or the worst case -- some kind of security incident. The operations teams tend to be an afterthought -- until there is a problem.
Gardner: For those Ops teams then -- rather than there be a lag, rather than be reactive -- you want to be proactive and to get out in front of these potential problems as much as possible. That requires more visibility, more knowledge, and more understanding about what’s going on before the problems set in.
Khan: Exactly.
Gardner: What are some of the obstacles to getting to that forward-looking approach? How do you get out in front of security risks and be able to deliver a rapid remediation response?
Get out in front of risks early
Khan: One of the main obstacles is being able to get involved early. Development teams can move very fast using their own cloud platforms du jour, their favorite environment. Now, having visibility from an operations and security perspective into any infrastructure du jour is not easy. Every platform, preferred infrastructure, cloud container, and hyperconvergence environment has their own way of providing visibility. They all have a different methodology for accessing traffic information on how to scale up, or for seeing all the virtual machines (VMs) and containers as they pop in and out of existence. That’s the hard part -- because the orchestration and automation for every platform is different. That’s what makes it very, very challenging.
For example, in some environments you have simple things like virtual private cloud (VPC) mirroring to analyze all the packets coming in so I can get the visibility I need from a security perspective. Yet some environments -- let’s say Microsoft Azure -- don’t quite have such a packet mirroring capability. There are also other ways -- eBPF, Sidecar, and other technologies -- involved in container insights.
There is value that can be extracted from the IT and network infrastructure information. Accessing that is how the security, network, and IT ops teams can bring value back to the developers, DevOps, and CloudOps teams.
So, the best way that operations teams can get involved early is by showing and adding value that’s tangible and front-and-center for cloud developers, for DevOps, and for the cloud operations (CloudOps) teams. To this day, the development team, the cloud team, the DevOps team -- they tend to not look at the infrastructure. In fact, they don’t want to worry about the infrastructure. It’s something they’re built to not have to deal with. However, there is value that can be extracted from the IT and network infrastructure information. Accessing that is how the security, network, and IT operations teams can bring value back to the developers, DevOps, and CloudOps teams.
Gardner: Today we have a mixed bag of deployment options, each with many different variables in how to gather and share infrastructure information. But even that doesn’t necessarily give a complete picture. We also have a chasm between what the developers are doing and what is going to happen in hybrid operations, post-production.
How do we achieve the almost impossible – the end-to-end and full lifecycle levels of insights?
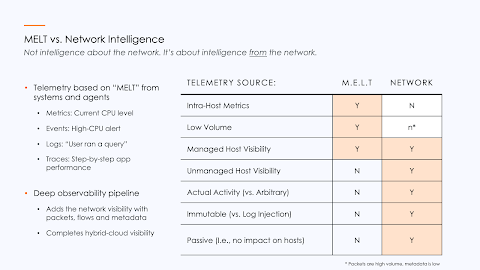
Khan: There are many different ways of seeing what’s going on in your environments, and ways of getting the data points from all of those insights. There’s something called MELT, which is metrics, events, logs, and traces. It consists of the most common ingestion telemetry and input data that all of the cloud tools operate with.
As you know, logs are quite informative and provide a very broad view, whether it’s from on-premises or cloud-type workloads. Logs are a good normalization mechanism. However, that’s not sufficient because logs only track the environment creating the log files. There could be more hosts out there, there could be communications not generating the level of log files needed from a security perspective.
We’re finding that -- while lot of people feel comfortable with the MELT data -- when we bring up the larger pool of telemetry-based communications happening between the hosts -- not just for managers, but for all hosts in the systems, and all the communications -- our customers say, “Wow, that is something that’s very cool, very helpful, and was never possible before.”
Gardner: How do we get past the MELT data and advance into deep observability? How do we excise that data and provide the fuller, richer, and faster view of what’s truly happening across all relevant activities?
Cooperate, collaborate for security’s sake
Khan: We have been talking to a lot of customers over many months and years about where the industry is headed. If you talk to IT industry analysts and other industry gurus, they describe where things are headed from a technology perspective.

But we took a different approach by doing research through more than 100 closed-door conversations, looking at our customer’s futures, by talking to our partner vendors, and based on other knowledge we have about the industry. Our approach evolved from a teams, tools, and telemetry perspective.
First, there are the people. What are their roles and responsibilities? In most of the cloud initiatives, there are different teams responsible for deploying and managing various workloads. You have developers on one end, all the way through to operations, and also all the way over to the NetOps side.
Now, these teams have tended to not be very cooperative or collaborative. The DevOps team is not pulling in the SecOps and NetOps as early as possible, as they should be. As a result, the SecOps team has to play catch-up. The NetOps team has to go into a mode of mean-time-to-innocence, to say, “Hey, this was not an infrastructure thing. This was some other application-related issue.”
What we have found, Dana, is these relationships are beginning to improve. People are starting to become more collaborative. It’s not overnight, but it’s getting better because of -- security. Security is the common denominator and common cause across all of these groups.
Nowadays, a DevOps person is much more conscious and spends more time working on security-related issues. The same thing with NetOps. Today, we find much better collaboration between networking and security.
Nowadays, a DevOps person is much more conscious and spends more time working on security-related issues. The same thing with NetOps. I joined Gigamon about four years ago, and I’ve had lots of conversations with NetOps teams and SecOps teams. There was a much deeper chasm between these two groups before.
But today, we find much better collaboration. It’s not perfect yet relationship-wise, but it’s better collaboration. You cannot be a network operator today and not spend at least half of your time working on security-related issues.
Now, as we said, security spans a lot of different areas. When we talked to customers, we talked to C-suite-level people in very large IT organizations. When it comes to detection, that’s not going to change; that’s going to stay a SecOps function and will stay in the security operations center (SOC), as far as we can tell.
However, when something is detected, like a breach or cyber threat activity, that’s when the other teams become involved in making the response, working on remediation, and then an even further, more-proactive stance around vulnerability mitigation. Detection and management -- that’s where all of the teams are involved working together.
Once you set down a zero trust approach, which is starting to pick up adoption as an architecture, the DevOps, NetOps, and SecOps teams are much more involved.
Now, the challenge has been that MELT consists of very powerful information. However, the tools that people use to leverage that information are siloed. They tend to be defined based on the ingestion data that they’re getting. So, when you look at metrics, events, logs, and traces, that’s the ingestion point for the tools that the developers are working with.
When you look at security-related tools, particularly data center security-related tools, which all of compliance is built on -- controls, knowledge base, all of that -- that tends to be more around packet-type information because that’s what you had in the data center. This chasm is causing a lot of problems. It prevents, for example, a DevOps person from doing security work because they’re missing out on endpoints that are not managed and don’t have an observability agent.
They’re not seeing the unmanaged traffic. There are not many security use cases that they can get to. That’s the chasm. That’s what we’re hoping the industry can address and we can help out with in the IT world.
Gardner: I completely agree that the security imperative provides a common denominator that joins disparate IT cultures, which is a good thing. If security drives a common purpose, an assimilation value, we need to get the right data to spur on that common security value proposition. How does the deep observability pipeline help get the right information to empower security as an imperative and then bring these groups together to take the proper action?
Visibility fabric sees past siloes
Khan: If the two worlds remain separate, even though a DevOps person wants to do security, they’re not able to. That’s true even using in-house observability tools based on Kibana and Grafana. These tools and the data ingestion approach is causing the groups to stay siloed, which is not ideal.
Instead, based on what we have seen over the years at Gigamon, and at other vendors as well, we have developed the notion of a visibility fabric.
Here’s why. The tools on the left-hand side cannot ingest network information, like packets and flow records, and do deep packet inspection. Yet that information is essential. We open up the packets, look at what’s inside, and create a bill of materials of what’s in the packets. We send that to the tools using such means as Kafka or JSON, depending on the tools.
Now, you’re able to use the observability tools to look for more security use cases, such as self-signed certificates, which are usually a red flag. Are there any old Secure Sockets Layer (SSL) ciphers out there in production today? That’s another vulnerability that needs to be flagged.
So, now the observability tools can be used for security functions, and not just for managed hosts, but unmanaged hosts as well.
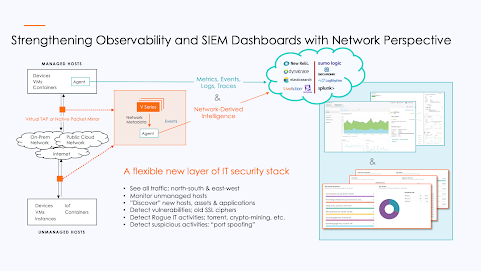
Where the observability pipeline comes in, Dana, is something Gigamon has introduced quite recently. We have stretched the value out further so it’s not just security information, saying, for example, that Bassam is running cryptocurrency mining activity on some AWS instance. But we can also now say where Bassam downloaded an application, identify a command control communication, and determine how and where the crypto mining software was installed. All of this is packaged into a contextualized export -- a very targeted and small export -- that gets sent to an observability tool, such as New Relic, Datadog inventories, or even a security information and event management (SIEM) tool like a Sumo Logic, Splunk, or QRadar.
Based on the new level of network visibility, we can deliver much more contextualized data. The deep observability pipeline approach not only provides much stronger defenses in depth, which is what security wants, they are able to democratize a lot of the functions of security. That means they are much more efficient. A lot of the preventative and proactive vulnerability management can be done by other teams, very voluntarily. They are getting pulled into cloud projects earlier, and the DevOps people are very accepting of the security use cases.
They’re very open to it, and they’re very fast to deploy the security use cases because now they have that capability. And the vendors such as the New Relics and the Datadogs and others are now saying that the security use cases are their number one goal because there’s a lot of value.
Are they looking to move into the system-on-a-chip (SOC) and become a SOC tool? Probably not for a while. And they’ll tell you that if you talk to them. However, being able to do security functions is very important for the DevOps and the developer sides. So, they’re bringing in that capability.
The last point is kind of interesting. We’re now finding that the DevOps people don’t want to have to go into a deep observability pipeline and deploy tools that collect and aggregate network traffic. That’s infrastructure stuff.
Instead, they say, “Hey, Mr. or Ms. NetOps, can you please come over and help me deploy this because the metadata value that I’m getting out of that traffic is super useful to me.” So now the NetOps people teams are being called in early.
Based on a new level of network visibility, we deliver much more contextualized data. The deep observability pipeline approach provides much better defenses and democratizes a lot of the functions of security. That means they are much more efficient.
And here’s the side effect that we’re seeing. I’m going to date myself. I started my career in IT in the 1990s and for an investment company in Boston. We didn’t have a network team when I first joined. We had a telecoms team, and this team went through a transition throughout the 90s because they were wiring phones. But they’re also wiring network connections -- Ethernet cabling all over.
What we found is that over the years, there was a split within that group. Some of the group decided to stay in telephony and they ran the telephone systems and switches. But part of that group became the networking group -- network engineers and then ultimately architects and operators. We saw that split happen.
Now, some 20-odd years later, we’re seeing a similar kind of split happening because of this observability technology, which allows the NetOps teams to be much more involved in the cloud projects. We are seeing a split in careers as well. A lot of the network engineers are contributing and becoming much more involved -- and almost forward-looking -- with cloud initiatives. It’s kind of cool.
Gardner: Well, now you have raised another group that we should be addressing, the NetSecOps people.
Increase visibility in the cloud and network
Khan: Yes, NetSecOps becomes even more relevant because what they’re now able to do is provide a lot more value to the essential cloud operations, cloud applications, and application modernization efforts by getting more contextual information from the networks.
A lot of the cloud migration and the cloud mentality is, “Oh, I’m moving this to the cloud. It’s a cloud workload now. I don’t have to worry about the network.” And that’s true. The cloud service provider will guarantee your up-times, response rates, and bandwidth -- all of that is guaranteed. You don’t need to worry about that.
However, it’s a little bit like the baby with the bathwater, there is important information you can glean from network communications – and you don’t want to throw it all out. Now, we like to say, the network analytics data is less about gathering intelligence about the network. It’s much more about intelligence derived from the network -- and that’s where NetSecOps and even NetOps teams are playing bigger and bigger roles.
Gardner: All right, let’s unpack the packets, if you will. When we go to the network to get the intelligence, the data there can be overwhelming. Also, is there a performance hit from the tools and the analysis? What are some of the nuts and bolts, brass tacks, if you will, about practically accessing that crucial and more strategic data in a meaningful way from the networks and then sharing it in an impactful way?
Khan: You hit the nail on the head. If not done correctly, costs can overrun very quickly. I am talking about data and communication costs. The two use cases are packets, which are still very relevant in the cloud, we are finding. As people move closer to the cloud, they realize that, “Hey, we’re not able to have as much control over and visibility to the data that we need.”
For example, we recently had a conversation with Lockheed Martin about Cybersecurity Maturity Model Certification (CMMC) 2.0 compliance. As part of their requirement from a CMMC compliance perspective they need to inspect the packets -- even in the cloud workloads. The problem is you have multiple tools.
There are the CMMC compliance tools, a network detection response (NDR) tool, and more. So, you have three, four, five tools. The packets are flowing all over the place to the instances, where the tools are running in the VMs. The compliance reporting is running, and all of this can get pretty expensive. You’re paying for bandwidth over and over and over -- and not all tools need to see all the traffic.
If you take the entirety of your VM traffic, pull it all together, and send it over the wire, it’s going to get really expensive. This is where the cost-optimization comes in. It can find the tool and say, “You know what? This tool is only going to see this needed traffic.”
Not all of your monitoring tools -- or even security tools, for that matter -- need to look at all the kinds of traffic. If there’s a multi-GB Windows update, for example, not all tools need to see that traffic as well.
The deep observability pipeline approach allows customers to fine-tune -- from a packet perspective – both what types of protocols they want to see, and also, very specifically, what applications to exclude. That way we can get very, very efficient. That’s the packet inspection efficiency use case.
The second big efficiency use case is the notion of metadata, which is very important because of its capability to extract important elements from the traffic and send that off. If, for example, you have 1 gigabit per second of traffic, metadata exploitation will bring that down to less than 1 percent of the traffic coming in because it extracts intelligence about the traffic.
And, as we mentioned before, MELT data is great for a lot of purposes, particularly if there’s an agent running. If there’s an agent running on a host -- whether it’s an application, device, or a user machine or laptop endpoint -- it can get a lot of information. It can go deep into that host, find out how much CPU consumption is being taken, how much memory is left, and what are all the different services running on the machine.
However, what if there are certain data aspects it’s not able to deliver? What if that host does not have an agent? What if it doesn’t have the observability agent generating the needed level of visibility?And there are security considerations, which are really important, particularly for our US federal agencies that use Gigamon, which is all 10 major agencies. What we hear over and over is network data is the ground truth. It’s something that’s been around for a very long time, and it’s still very true.
One of the first things a threat actor will do once it reaches the system is they’ll try to cover their footprints. The way they do that is by turning down logging levels, by hiding themselves from the logging.
Well, you can’t hide the fact that Bassam’s machine went out and talked to this command-and-control system or moved laterally. Just can’t hide that. And, so, the network data is immutable. Also, importantly, the network insights are passive in the sense that when you put an agent on a system, it’s going to impose some level of resource consumption and from a maintenance perspective. There’s patching, upgrading, and a certain level of work involved in that.
But when you’re listening to network traffic, it’s completely passive. There’s no impact on the hosts themselves, whether they are managed or unmanaged. It could be an Internet of things (IoT) device, a printer, a surveillance camera, a heart machine, or even a fish tank. There was a case of a breach in a fish tank a while ago. But the point here is that these are the two big different use cases, and the two come together to make what we call a deep observability pipeline.
Gardner: All right. Given how important this network traffic information is, let’s get deeper into what Gigamon does, specifically that is differentiated and brings this information out in such a way that it can be used across different personas, use cases, and by both the security and operations teams.
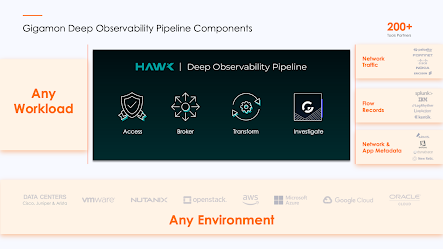
Deep observability pipeline to all the data
Khan: Our deep observability pipeline has four basic functions. The workload can run on any platform, any container, or on any physical endpoint, it doesn’t matter. We worry about the access mechanism, and we support every native data access mechanism so that our customers don’t have to worry about it. So rather than plugging in their 50 different tools that need access to network data or metadata, having to plug those tools into all of the different parts of infrastructure, we plug it in, they plug those tools on our port, either physical port or virtual port depending on whether it’s cloud or not.
We are responsible for accessing all the data. Then we can broker that out to any tool that wants packet data or metadata about the traffic. And that supports about 24 different – what we call GigaSMART applications -- where we’re cleaning up the traffic. Not all tools need to see all your traffic.
One of the most deployed functions that we have, for example, is called packet deduplication. When you have any kind of infrastructure you end up with duplicate packets because it’s an artifact of any complex type of infrastructure. And when you have duplicate packets, you’re flooding the tool with duplicate information. There’s absolutely no need for it. So, by deduplicating the duplicate packets, you’re saving a lot of traffic. A lot of organizations we go into have some 30, 40, or 50 percent duplicate packets, sometimes more. By deduping, you are instantly able to double the capacity of the tool because you’re not losing any fidelity of the data because the duplicate packets don’t do anything.
The 24 different traffic optimization and transmission capabilities come into any tool in any format that people may want. And we have been providing a lot more context around the data itself.
The 24 different traffic optimization and transmission capabilities come into any tool in any format that people want. As for Gigamon’s unique capabilities, a lot of these things are part of the visibility fabric that we talked about. The investigation part is something that’s unique where we’re contextualizing the data using our NDR technology that we have in providing a lot more context around the data itself.
Our integration with cloud-based observability tools is super unique. When you have a managed host, whether it’s running in the cloud or on physical devices, or hybrid IT, the cloud versions of the observability tools, of the SIEMs, need access to the data, and that comes in over an agent. For example, you install a Datadog agent to all of your managed hosts out there or whatever your observability tool of choice might be and you’re able to send it.
Gigamon’s GigaVUE V Series forms the intelligence, the brains, of another product. We get the traffic using our own tapping, or using native packet mirroring, if that’s available. Then using the same agent, we collect and send that data as events to the tools. It’s a completely different perspective that complements existing observability dashboards, in your queries, the alerts, and everything else your DevOps person has set up.
Again, this enables being able to do security use cases. Again, it’s not necessarily intelligence about the network -- it’s intelligence from the network. And it’s the entire network. It’s managed and unmanaged hosts. It’s hosts that are talking without any kind of agent running on them.
A simple use case: Let’s say your SIEM, your Splunk, is supposed to be tracking all of the activities of all the hosts running in your system. What our customers find, as soon as they bring in this level of visibility, is some things are missing. All the hosts are supposed to be tracked by your SIEM but there’s a delta. You’re not seeing all of the hosts. Some applications or APIs are running that are unsanctioned. Something weird is going on. They need to worry about that.
That is an example of a vulnerability, assessment, and management detection that’s now within the realm of a DevOps person who has never done that before. And in order to get this sorted out, typically, a NetOps person will come in and make sure that the agent is installed, and the V Series is running and sending the needed data over. The NetOps people get pulled in early because there’s a lot of value that the DevOps person, the right-hand side, is able to get from this and the use cases.
Gardner: We can’t do this just based on what the cloud provider has served us in terms of visibility. We can’t do this just from what we had inside our respective data centers because it doesn’t consider the entire hybrid cloud extensions of our workloads. And there may be unseen hosts. But we need to track it all.
To attain this new level of deep observability, what do people need to put in place to get there?
See all data in all the directions
Khan: The capabilities come in basically two different groups. One is the packet-type of capabilities. It is a better level of security from a NDR perspective, and from a compliance perspective.
For example, Five9, one of the largest cloud-based contact centers, needed PCI-compliance when needed they moved to a public cloud. You can’t do that without having this deep level of observability having your arms around all of the communications going on. Keep in mind this is not just for the edge, north-south communication is their public cloud. This is for east-west traffic as well, which includes VM-to-VM as well as container-to-container traffic.
For such, larger organizations with multiple on-premises and cloud workloads, the attack surface grows, which makes the need for this high visibility into packets foundational as a security requirement. The second big round-up bucket of benefits comes from the metadata.
I’ve talked a lot about the DevOps-ready pipeline. Let’s see what it looks like. As I mentioned, there are multiple partners we use. In this case, I shall go into New Relic. And what we’re seeing here is a dashboard that we have created.
We have the data coming into an agent and into the New Relic observability tool. This data is completely derived from network intelligence, from the deep observability pipeline. This is the first-ever capability of having this level of network intelligence. There will be some red flags going off. There’s SSL running in this environment, even if there’s one or two flows, one or two hosts talking SSL; that’s a big red flag. That should not be happening. Some weak cypher is running. This is the type of information that people find very valuable -- and even more so because this is being sent to a DevOps person.
Are there any Dynamic Host Configuration Protocols (DHCPs)? Are there any Domain Name Server (DNS) redirections going on? For example, I might have installed a browser plug-in, so if I type in Gigamon.com rather than just using the on-premises DNS name resolution, it’s going into a third party and that’s a big red flag. It’s just not an acceptable security practice.
I mentioned some security use cases, but they’re also performance use cases. What we can show, for example, is the HTTP response time. We also have a widget that shows the Transmission Control Protocol (TCP) response time. When data calls up and says, “Help, my application is running slow.” If the NetOps person or even the DevOps person in this case can see that TCP response time is trending flat, it hasn’t changed. But HTTP response time has spiked. That means guess what? It’s not a network connection issue, it’s an application issue because it’s at the TCP level, it’s an application-level issue. So, there is instant resolution for some of these troubleshooting types of issues.

We can also see, via simulated data, that BitTorrent is running. So peer-to-peer (P2P) traffic, which is the thing by the way. Side story, we went into one of our government agencies and when they turned on what we call this application intelligence capability, I said, “This is great. I can see all the applications. I can see what’s running.” But it’s not right because it says we have BitTorrent running in our environment, and this is a pretty secure environment. And then our sales engineer said, “No, that’s what it says and then their NetOps person looked into it like, “Come with me.” He just grabs our sales engineer’s laptop and drags him into their SOC, and says, “Guys, we have BitTorrent running.” And everybody in the room said, “No, that’s not possible.” But when they looked into it, sure enough, they had BitTorrent running. Somebody, somehow, installed that.
So even in a very safe environment, you will find unknown applications called rogue applications. Where it gets interesting is that these are sometimes crypto mining applications. There was a case a couple of years ago, where Tesla’s AWS infrastructure was compromised and rather than attacking using some direct attack onto Tesla’s applications, bringing down systems, the actor installed cryptocurrency mining called Monero, which is actually this MINEXMR, Monero, and they sat there for months and months just mining cryptocurrency.
A Google report came out about seven months ago. They looked at all of the breaches that happened in Google Cloud. They found that 86 percent of the time the attacker came in and installed cryptocurrency mining. The attackers did other things, that’s why the percentages can be over 100; they did other nefarious activities. People install cryptocurrency mining, why? Because this is the shortest route from point A to point B, which is monetization.
Gardner: How does this then relate to zero trust architectures? How does the deep observability pipeline relate to zero trust now that it’s being mandated in the public sector and it’s becoming a de facto standard in the private sector?
Gigamon at the core of the zero-trust
Khan: Yes, zero trust has been advancing in the federal space, where Gigamon has a strong presence. We’ve been going on that journey with our customers. And we’re starting to hear more about it in the enterprise business world as well.
One of the foundational approaches to zero trust is about policies. It’s about identities and segmentation. The policy engine input assumes that all of the communications are being captured. If you have blind spots, if you’re not looking at inspecting Transport Layer Security (TLS) traffic, encrypted traffic, you should be. If you’re not looking at east-west communications, container communications, that’s going to lead to blind spots, and zero trust assumes that there is visibility in all of the traffic in all of the communications that are going on.
That’s where Gigamon comes in. We provide the core foundation to what John Kindervag, a Forrester analyst, first wrote about around zero trust more than 12 years ago. He used to call it the DAN, the Data Access Network. The foundation to zero trust is being able to have access to all of the data, and that’s where Gigamon comes in.
We provide the needed telemetry, the visibility, and the blind spot elimination that are foundational for every zero-trust journey. So as a result, we’re baked into almost all of the federal organizations and federal department agency projects to build a zero-trust journey on. And we’re starting to see that happen more and more on the enterprise side.
Gardner: We’ve talked in general terms about the deep observability value, and it certainly sounds very compelling. It makes a great deal of sense given the hybrid and dispersed nature of workloads these days. Going to the network for the required insight is absolutely something that you can’t deny. But we haven’t talked about metrics, or public key infrastructures (PKIs). Do you have any demonstrative definitions, qualitative or quantitative, of when you do deep observability in these complex environments what you can get as security performance agility cost savings?
Khan: There are a number of ways our customers measure how efficiently Gigamon helps. By optimizing traffic, we are also helping all the other tools, too. So, people say, “Hey, you have this intrusion detection system (IDS) tool, you have this web application firewall (WAF), you have this application performance monitoring (APM) tool that we pay for. If I’m going to ask for additional budget to buy more of those tools, it is because I’m running this as efficiently as possible.” Gigamon shows how much traffic is coming into each tool and how much it’s been made efficient.

When they put a proposal in to buy anything in the data center, we find they staple the model to the actual proposal to their finance group on why they need more equipment. That’s because we have visibility and all the data in motion to quantify the benefits from a cost-savings perspective, which is a big factor given all the budget uncertainty that’s happening right now.
Gardner: You mentioned deep observability as a force accelerator among the tools ecosystem. It frees the network data for use by many insights and analysis values. You work in an ecumenical orientation. What do your partners say to that?
Khan: Most of the new customers we work with are brought to us by partners, both technology and channel partners. We allow their deployments to be much more successful. We do that by eliminating blind spots. They need to see, for example, decrypted traffic to do their job, but they don’t need to see things that are not essential. Things like masking technologies that we provide allows a much safer way of decrypting with compliance and that allows tools to be much more efficient and effective.
The new category of deep observability pipeline and tools is where the real innovative work is happening. It’s an expansion of a DevOps person’s ability to look at 10 to 20 percent of an infrastructure that have agents running and opening their eyes to the entire 100 percent of the infrastructure by seeing all communications happening from a security and vulnerability perspective. That’s where we’re seeing a ton of traction and new partners coming to us saying, “Hey, I heard you do this. Let’s work together.”Gardner: That’s exciting because oftentimes when you provide new capabilities into the field, people will be innovative and find creative new ways of using them that hadn’t been determined before. And it certainly sounds like we’re right on the cusp of some of that innovation using deep observability.
Khan: That’s right. Exactly.
Listen to the podcast. Find it on iTunes. Read a full transcript or download a copy. View the video. Sponsor: Gigamon.
You may also be interested in:
- How deep observability powers strong cybersecurity and network insights across complex cloud environments
- Why deep observability is key to realizing the full transformational promise of the cloud
- Deep Observability Defined
- The Future of Observability is Beyond MELT
- How to amplify the power of your security and observability tools to realize the full transformational promise of the cloud
- How Gigamon Application Metadata Intelligence empowers security information and event management
- Learn about the next level of network intelligence known as deep observability
- Gigamon Achieves AWS ISV Accelerate Program Designation
- Gigamon CTO Discusses Observability vs. Deep observability
- What CISOs think about cyber security, visibility and cloud
- Gigamon Releases 2022 TLS Trends Research Based on 1.3 Trillion Network Flows


No comments:
Post a Comment